Auto Sales Data Visualization
This project involved building interactive dashboards to analyze sales trends and customer demographics for an auto sales company.
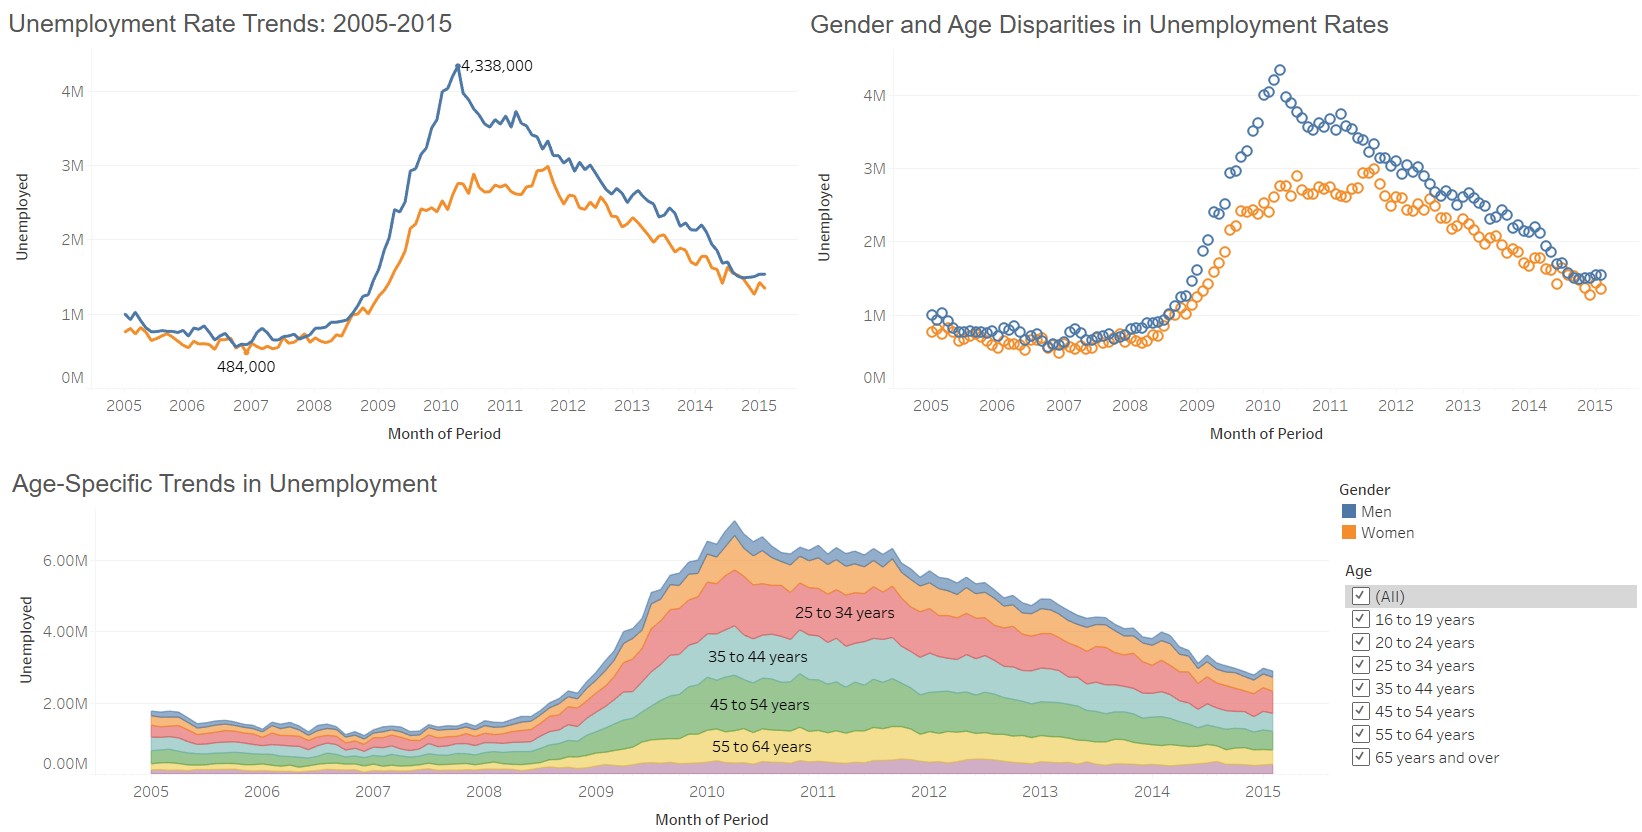
Project Overview
The goal of this project was to create a comprehensive and interactive dashboard that would allow stakeholders to easily explore and understand auto sales data. By visualizing key performance indicators (KPIs), we can identify trends, spot anomalies, and make data-driven decisions.
Key Features
- Sales performance tracking by region, model, and time period.
- Customer demographic analysis to understand the customer base.
- Profitability analysis to identify the most and least profitable products.
Tools Used
- Tableau (for data visualization and dashboard creation)
- SQL (for data extraction and preparation)